Centralized Logging for Homelabs with Grafana Loki: A Practical Stack for Docker and Linux Hosts
Build a practical homelab logging stack with Grafana Loki, Alloy, and Grafana. This refresh focuses on documented collection scope, labels, retention, and troubleshooting flow.
FTC disclosure: This article contains affiliate links. If you purchase through these links, HomelabAddiction may earn a commission at no additional cost to you.
Documentation basis: This refresh is based on primary vendor or project documentation. No hands-on testing is claimed unless explicitly stated. Primary sources used in this refresh:
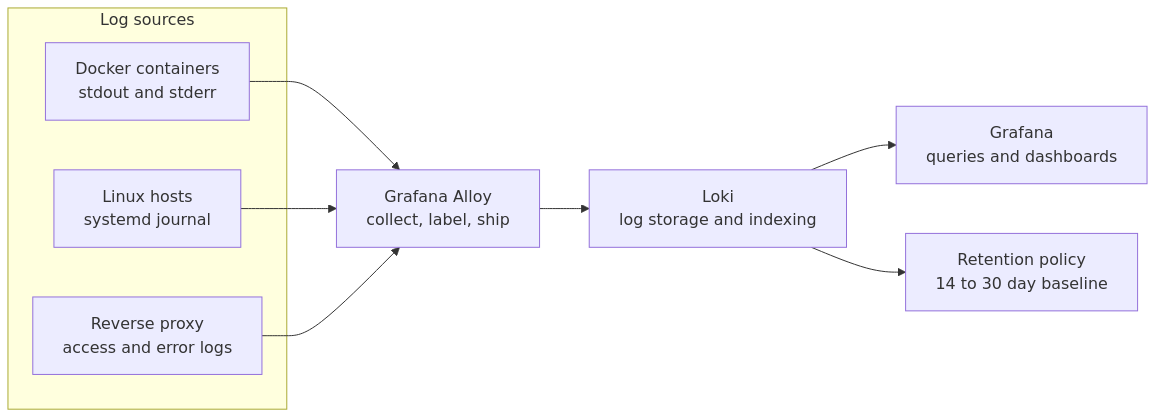
Figure: a simple homelab logging path from Docker and Linux hosts into Alloy, Loki, and Grafana.
Key Takeaways
Grafana Loki is often the lighter operational fit for homelabs that need searchable logs without standing up a heavier full-text stack.
For fresh deployments, Grafana Alloy is the documented default collector path to plan around even if older guides still show Promtail examples.
Start with Docker stdout or stderr, Linux journal logs, and reverse-proxy logs before widening scope to every file on every host.
Retention and labels matter early: a short, well-labeled dataset is more useful than a noisy pile of unlabeled logs.
Logs work best when they sit next to metrics and alerts, not as a separate troubleshooting island.
This page helps homelab operators centralize logs from Docker and Linux hosts by providing a documented Loki-plus-Alloy baseline that stays queryable without dragging in unnecessary complexity.
The refresh is based on primary Grafana documentation for Alloy, Loki, and LogQL. No hands-on testing is claimed unless explicitly stated on the page.
A practical starting point is one observability node that receives logs from containers, host journals, and reverse proxies, then keeps retention short enough that storage stays boring and search stays fast.
Why Loki Often Fits a Homelab Better Than ELK
This is the part where every logging article politely compares Loki to ELK and pretends the answer is mysterious. It is not mysterious.
If you run a small or medium homelab, Loki is usually the right answer.
ELK can do excellent full-text search at scale. It can also eat RAM like it is trying to prove a point. Loki stores logs more efficiently by indexing labels instead of every word in every line. That tradeoff is exactly what most homelabs need.
You usually know what you are investigating. You know the host, service, container, or VLAN segment that started behaving like a toddler with admin access. Loki is fast enough when you filter intelligently.
Use ELK if you genuinely need very heavy, broad, arbitrary search across a lot of logs and you have the hardware budget. Otherwise, keep your life simple.
A Practical Initial Scope
Do not start by collecting everything.
Start with these three sources:
1. Docker container logs from stdout/stderr
2. Linux system logs from journald
3. Reverse proxy logs from Traefik, Caddy, or Nginx Proxy Manager
That covers most real incidents in a homelab. It also gives you useful context when paired with metrics from a stack like the one I covered in Homelab Monitoring with Prometheus and Grafana.
Later, you can add firewall logs, DNS logs, or application-specific files. On day one, restraint is a feature.
The Architecture
For a typical homelab, I like one central observability node:
Loki stores logs
Grafana queries and visualizes them
Grafana Alloy tails logs and ships them to Loki
You can run the whole thing on one low-power mini PC or a small VM. If your lab is modest, that is enough.
For multi-node setups:
run Loki and Grafana on the central node
run Alloy on each host you want to collect logs from
keep retention on the Loki node, not spread across random app boxes
For log retention, I would rather have a dedicated 1TB NVMe SSD than pretend my root disk has infinite patience: 1TB NVMe SSD options
If your logging node is part of your monitoring and alerting path, put it on a UPS so power blips do not take out the thing that explains why power blips hurt: UPS options for homelab gear
transmission signup
article_topic // Centralized Logging for Homelabs with Grafana Loki
Don't leave without the setup notes.
Get practical homelab guides, failure logs, and beginner-friendly build notes in your inbox.
Enter your email address to receive the Homelab Addiction newsletter.
Weekly only. No spam. Unsubscribe anytime.
Do you need all of that? No.
Will you eventually appreciate having it? Usually yes.
Docker Compose Stack for Loki and Grafana
Here is a minimal stack I would actually run on a central node.
Why 14 days of retention (336h)? Because that is long enough for most homelab troubleshooting and short enough that your SSD does not become a landfill for old container noise.
If you know you generate almost nothing, go longer. If you run chatty apps, go shorter. Logging without retention policy is just hoarding with YAML.
Why Alloy Is the Better Default Instead of Promtail
This is the biggest gap in current search results.
Most articles still walk through Promtail. Promtail still works. But the more future-looking choice is Grafana Alloy, which combines log, metric, and trace collection patterns under one agent family.
If you are building fresh, Alloy is the better documented default unless you have a specific reason to stay with Promtail for now. You will save yourself a migration later.
If you want to scrape journald directly on the host instead of just /var/log/*.log, you can do that too. The exact shape depends on whether Alloy runs in a container or directly on the host. My advice is simple: start with what you can verify quickly, then widen collection one source at a time.
A Common Labeling Mistake
The mistake I made: I treated labels like free metadata.
They are not free.
In Loki, labels are how you narrow the search space. Useful labels are things like job, host, container, stream, and maybe environment if you truly separate lab segments. Bad labels are high-cardinality chaos, like request IDs, full paths that explode in variation, or dynamic values that produce endless unique combinations.
A sane baseline label set for homelabs is:
job
host
container
stream
That is enough for most debugging. Add more only when you have a reason.
Useful LogQL Queries
Once Loki is wired into Grafana, these are the kinds of queries that earn their keep.
Count error lines by container over the last hour:
sum by (container) (count_over_time({job="docker"} |= "error" [1h]))
Show warning and error noise from one app:
{container="paperless"} |~ "(?i)warn|error|fail"
These queries pair nicely with service health checks, especially if you are already using patterns like the ones in Docker Health Checks Explained.
Retention and Storage Planning
A lot of guides say "set retention" and move on. That is not enough.
You need three decisions:
1. how long logs are useful
2. how much storage you are willing to spend
3. which containers are too noisy to keep forever
For most homelabs, 7 to 14 days is a good default. If you run public services, I lean toward 14 days. If you are experimenting constantly, 7 days may keep your disk happier.
What matters more is identifying noisy workloads. Media apps, reverse proxies, and backup jobs can generate a surprising amount of junk. If one container spits out endless access logs or debug output, fix that at the source before you throw more disk at the problem.
The same discipline applies to backups. In Restic Backup for Homelabs, the core principle was not "back up everything forever." It was "keep the important data recoverable without making the system miserable."
Logging should follow the same rule.
From the lab
How to Integrate This with the Rest of a Homelab
Logs are not a replacement for metrics. They answer different questions.
Metrics tell you what went weird. Logs tell you why.
When a CPU graph spikes in Grafana, the next step should be one click into the relevant log stream. When a backup job fails, the relevant error line should be visible without SSHing into the failed box. When an app cannot reach the internet, I want to correlate its logs with a proxy issue like the one I discussed in Docker Daemon Proxy Configuration.
That is the real payoff: correlation.
You stop treating each incident like a scavenger hunt.
A Few Alerts Worth Creating First
Do not start with thirty alerts. Start with three or four that matter.
Create alerts for:
repeated container crash loops
failed backup jobs
reverse proxy 5xx bursts
repeated authentication failures on exposed services
That last one pairs well with a sensible network policy. If you are exposing anything at all, review your segmentation and controls too. My Homelab Firewall Rules guide covers the guardrails that help keep one loud service from affecting every host.
Common Problems and Practical Fixes
1. Alloy cannot see Docker logs
Usually one of these:
the Docker socket is not mounted
the container lacks permission to read it
you are trying to scrape logs from a path that is not available in the container
Start simple. Confirm the socket exists inside the Alloy container and that the labels show up.
Then confirm the datasource in Grafana points to the right Loki URL.
3. Disk usage climbs faster than expected
This is almost always noisy logs, bad retention, or both.
Lower the retention period. Reduce access log verbosity. Stop shipping garbage you will never read.
4. Queries feel slow
Look at your labels.
If your first instinct is to search all logs everywhere for a random string, Loki will feel worse than it should. Filter by job, host, or container first. Loki rewards discipline.
The Setup I Would Recommend for Most Readers
If you want the short version, here it is.
Run Loki + Grafana on one central node
Run Alloy on every Docker or Linux host
Keep 14 days of logs to start
Collect Docker logs, journal logs, and proxy logs first
Use simple labels
Create three useful alerts, not twenty useless ones
That gets you 80 percent of the value without turning logging into its own hobby.
And if logging has become its own hobby, I say this with respect: you may have accidentally built a second job in your basement.
What I Would Add After Day One
Once the core stack is stable, I add sources in this order:
1. reverse proxy access and error logs
2. SSH and authentication events
3. backup job logs
4. DNS logs from Pi-hole or AdGuard Home
5. selected firewall logs for exposed services
The order matters.
Reverse proxy logs tell you whether users or bots can even reach the service. Auth logs tell you whether something is poking at your boxes. Backup logs tell you whether your recovery story is real or just emotionally comforting. DNS and firewall logs come next because they are useful, but they can also get noisy fast if you ingest them without filters.
This is also a useful place to add a small dashboard panel set in Grafana:
top containers by error count in the last hour
reverse proxy 4xx/5xx spikes
failed login attempts by host
backup failures over 24 hours
noisiest containers by log volume
None of those are fancy. All of them are useful.
Promtail Migration Notes for Existing Labs
If you already run Promtail, I would not tell you to rip it out tonight just because Grafana wants the future to be Alloy-shaped.
If Promtail is working, keep it stable, document it, and plan a migration during a maintenance window like a civilized person. The real mistake is not using Promtail. The real mistake is having no notes, no config backup, and no idea which hosts are shipping what.
My practical migration checklist looks like this:
1. export or back up the current Promtail config
2. list the hosts, paths, and labels you actually rely on
3. rebuild the same collection scope in Alloy
4. test one non-critical host first
5. confirm labels and queries still behave the way you expect
6. switch the remaining hosts in batches
That last step matters more than people admit. Batch migrations let you catch bad labels, missing bind mounts, or silent ingestion failures before you take out visibility across the whole lab.
If your homelab already supports public-facing apps, treat the logging agent like any other important dependency. Change it in a controlled way. Heroic midnight rewrites are exciting, but mostly for the wrong reasons.
Frequently Asked Questions
Is Loki better than ELK for a homelab?
Usually yes. ELK is powerful, but it is heavier than most homelabs need. Loki is easier to justify when you care about practical troubleshooting more than enterprise-scale full-text indexing.
Should I still use Promtail in 2026?
You can, and a lot of guides still do. But for a fresh setup, I would start with Grafana Alloy unless you have a specific compatibility reason to stay on Promtail.
How much storage do I need for homelab logs?
For a typical lab, 7 to 14 days of retention on a 1TB SSD is a comfortable starting point. The real variable is noisy containers, not the theoretical elegance of your retention policy.
Can the job runs Loki, Grafana, and Alloy on one machine?
Yes. For small and medium homelabs, a single observability node works well. Split components across hosts only when your scale or failure domains justify the extra complexity.
Final Recommendation
If you are already watching CPU, RAM, disk, and uptime but still investigating incidents by opening five terminals, centralized logging is the next thing I would add.
Not next month. Not after the next rebuild. Now.
A modest Loki stack gives you faster troubleshooting, better visibility, and a much clearer link between a graph that looks wrong and the exact log line that explains it. That is a real quality-of-life upgrade in a homelab. Also, it cuts down on the fake confidence that comes from saying "everything looks fine" before you have checked the logs.
I have done that too. It was incorrect every time.
Sources and verification
This article was checked against the current project documentation for the collection, storage, and query components described above. Configuration details should be reconciled with the installed Grafana and Alloy versions before production rollout.